Share this infographic on your site!
Embed this infographic on your site!
The editors at Best Computer Science Degrees decided to research the topic of:
We Love Apps
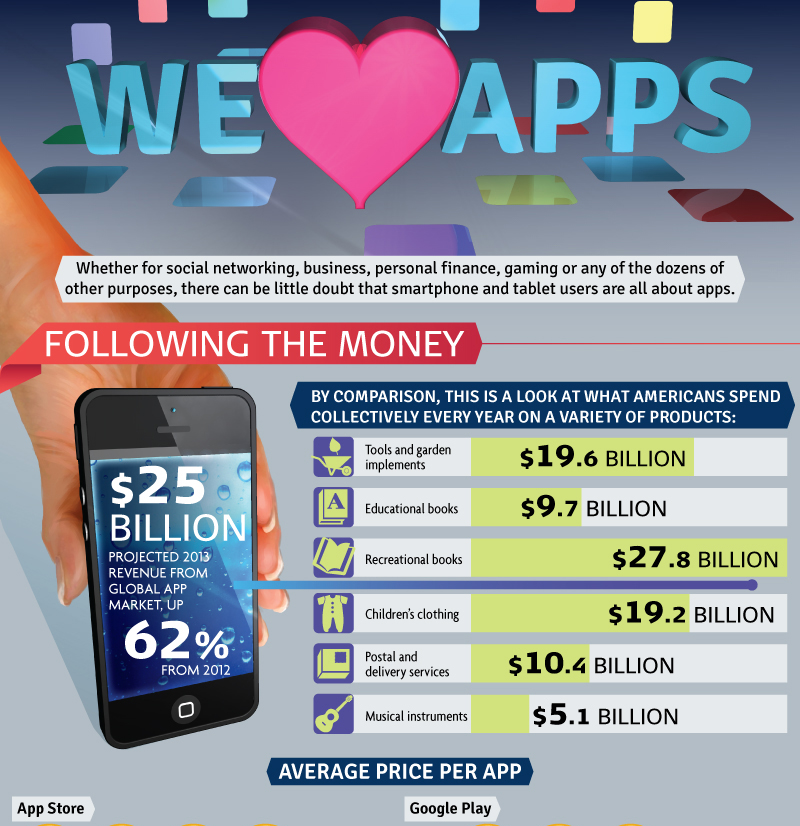
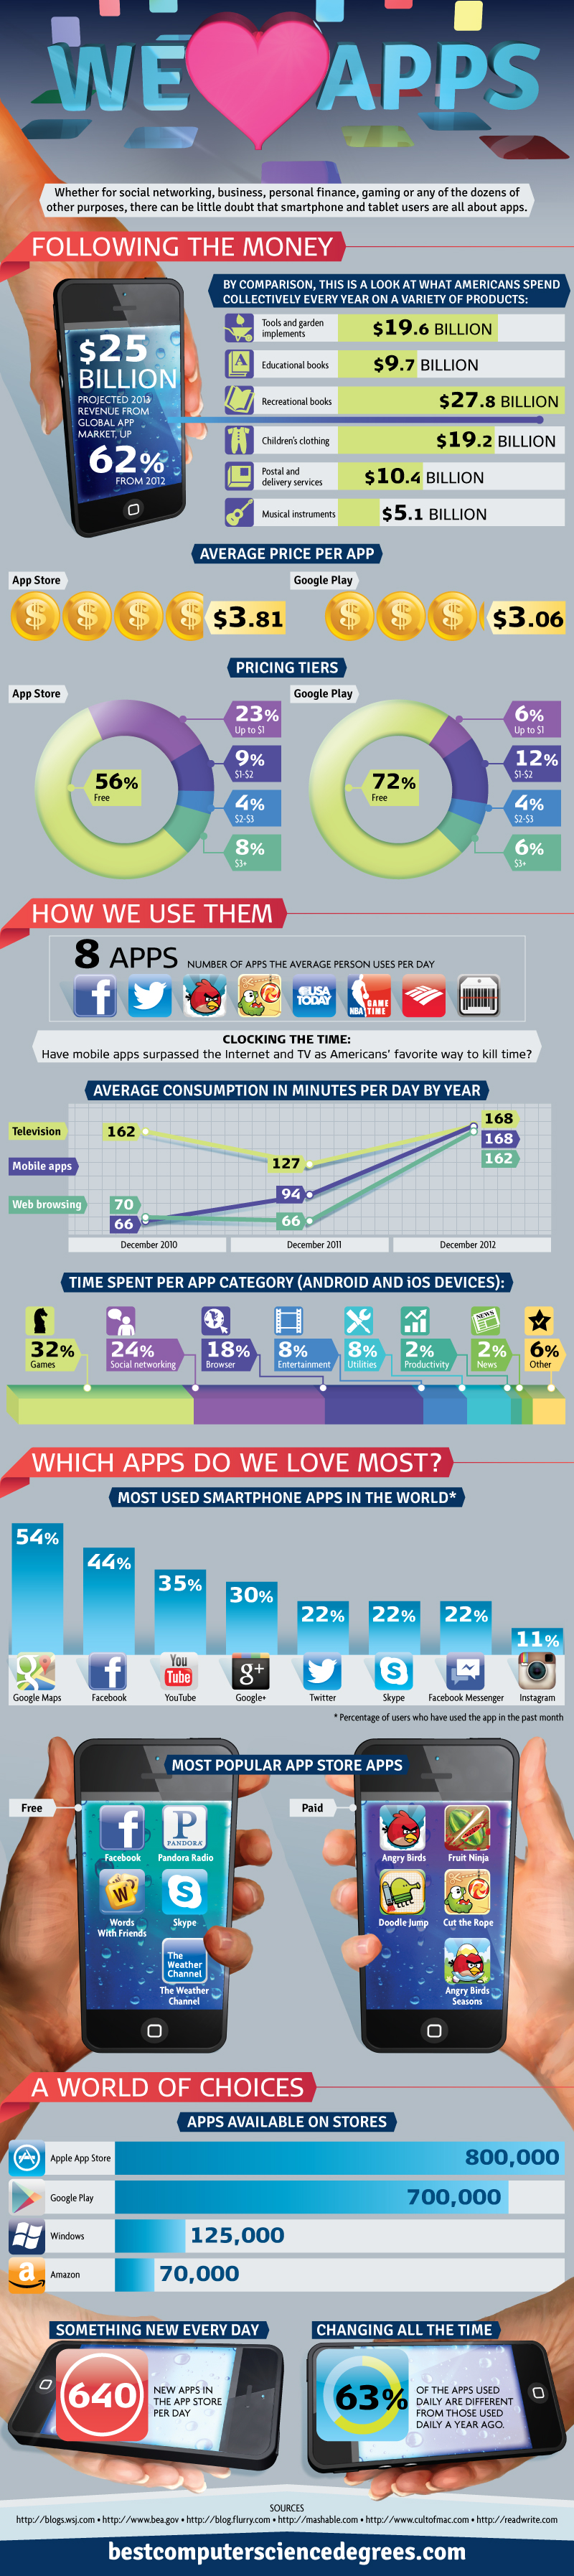
Whether for social networking, business, personal finance, gaming or any of the dozens of other purposes, there can be little doubt that smartphone and tablet users are all about apps.
Following the Money
$25 billion
Projected 2013 revenue from global app market, up 62% from 2012
By comparison, this is a look at what Americans spend collectively every year on a variety of products:
Tools and garden implements $19.6 billion
Educational books $9.7 billion
Recreational books $27.8 billion
Children's clothing $19.2 billion
Postal and delivery services $10.4 billion
Musical instruments $5.1 billion
Average price per app
App Store $3.81
Google Play $3.06
Pricing tiers
App Store
Free 56%
Up to $1 23%
$1-$2 9%
$2-$3 4%
$3+ 8%
Google Play
Free 72%
Up to $1 6%
$1-$2 12%
$2-$3 4%
$3+ 6%
How We Use Them
8 apps
Number of apps the average person uses per day
Clocking the time: Have mobile apps surpassed the Internet and TV as Americans' favorite way to kill time?
Average consumption in minutes per day by year
Web browsing Mobile apps Television
December 2010 70 66 162
December 2011 66 94 127
December 2012 162 168 168
Time spent per app category (Android and iOS devices):
Games 32%
Social networking 24%
Browser 18%
Entertainment 8%
Utilities 8%
Productivity 2%
News 2%
Other 6%
Which Apps Do We Love Most?
Most used smartphone apps in the world*
Google Maps 54%
Facebook 44%
YouTube 35%
Google+ 30%
Twitter 22%
Skype 22%
Facebook Messenger 22%
Instagram 11%
* Percentage of users who have used the app in the past month
Most popular App Store apps
Free
Pandora Radio
Words With Friends
Skype
The Weather Channel
Paid
Angry Birds
Fruit Ninja
Doodle Jump
Cut the Rope
Angry Birds Seasons
A World of Choices
Apps available on stores
Apple App Store 800,000
Google Play 700,000
Windows 125,000
Amazon 70,000
Something new every day
640
New apps in the App Store per day
Changing all the time
63% of the apps used daily are different from those used daily a year ago.
Citations
- http://blogs.wsj.com
- http://www.bea.gov
- http://blog.flurry.com
- http://mashable.com
- http://www.cultofmac.com
- http://readwrite.com